Table Top Navigation Test
Some basic testing can be done on the table top. Running the navigation unit using real hardware on the tabletop should allow us to determine if the navigation algorithm is working correctly.
Velocity continuously converges to zero. It does not stay zero because the position estimation is following the GPS measurements therefore whenever GPS changes position a estimated velocity is induced and then corrected out.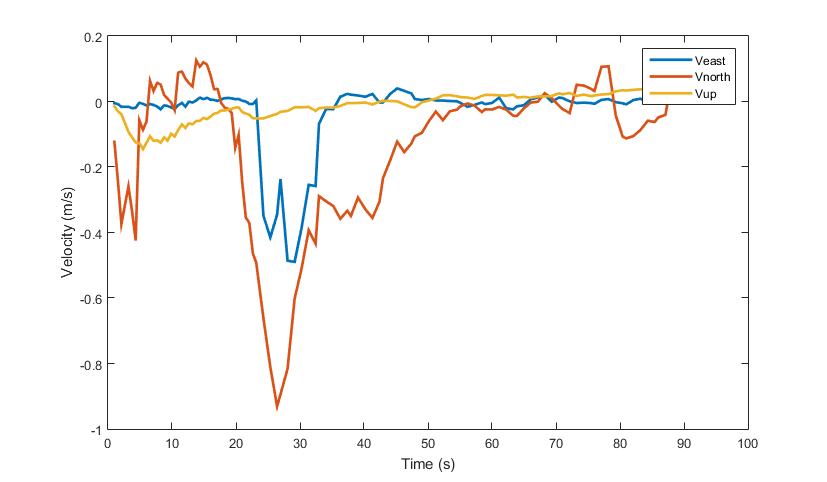
Roll and pitch both converge to near zero within a few degrees. This is expected as measurements of orientation are under determined and the estimation process for orientation is non-linear. The heading value accurately portrays the heading of the unit.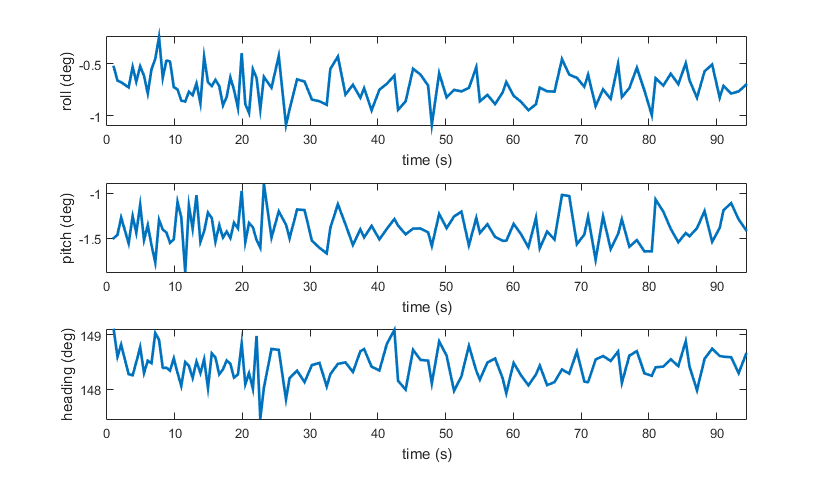
Acceleration corrected by estimate accelerometer bias converge to near zero. The measured acceleration on the Z axis is near 9.81 (m/s^2) because it is measuring the normal force the table exerts on the electronics unit. The values do not converge exactly to zero because the pitch and roll estimations are not exactly perfect.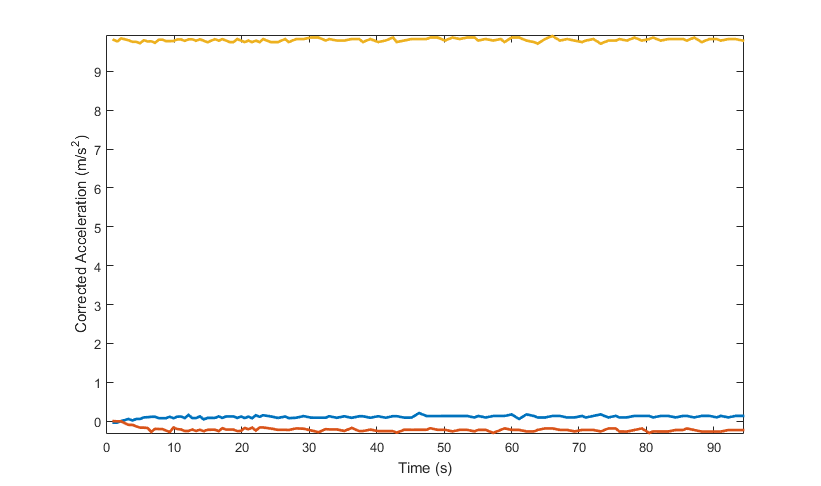
Angular velocities corrected by the estimated gyro bias from the kalman filter converge to zero. This indicates correct estimation of gyro bias.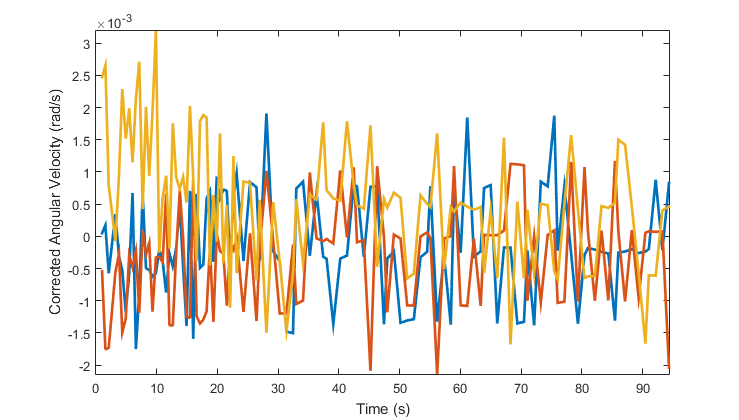
Experimental setup
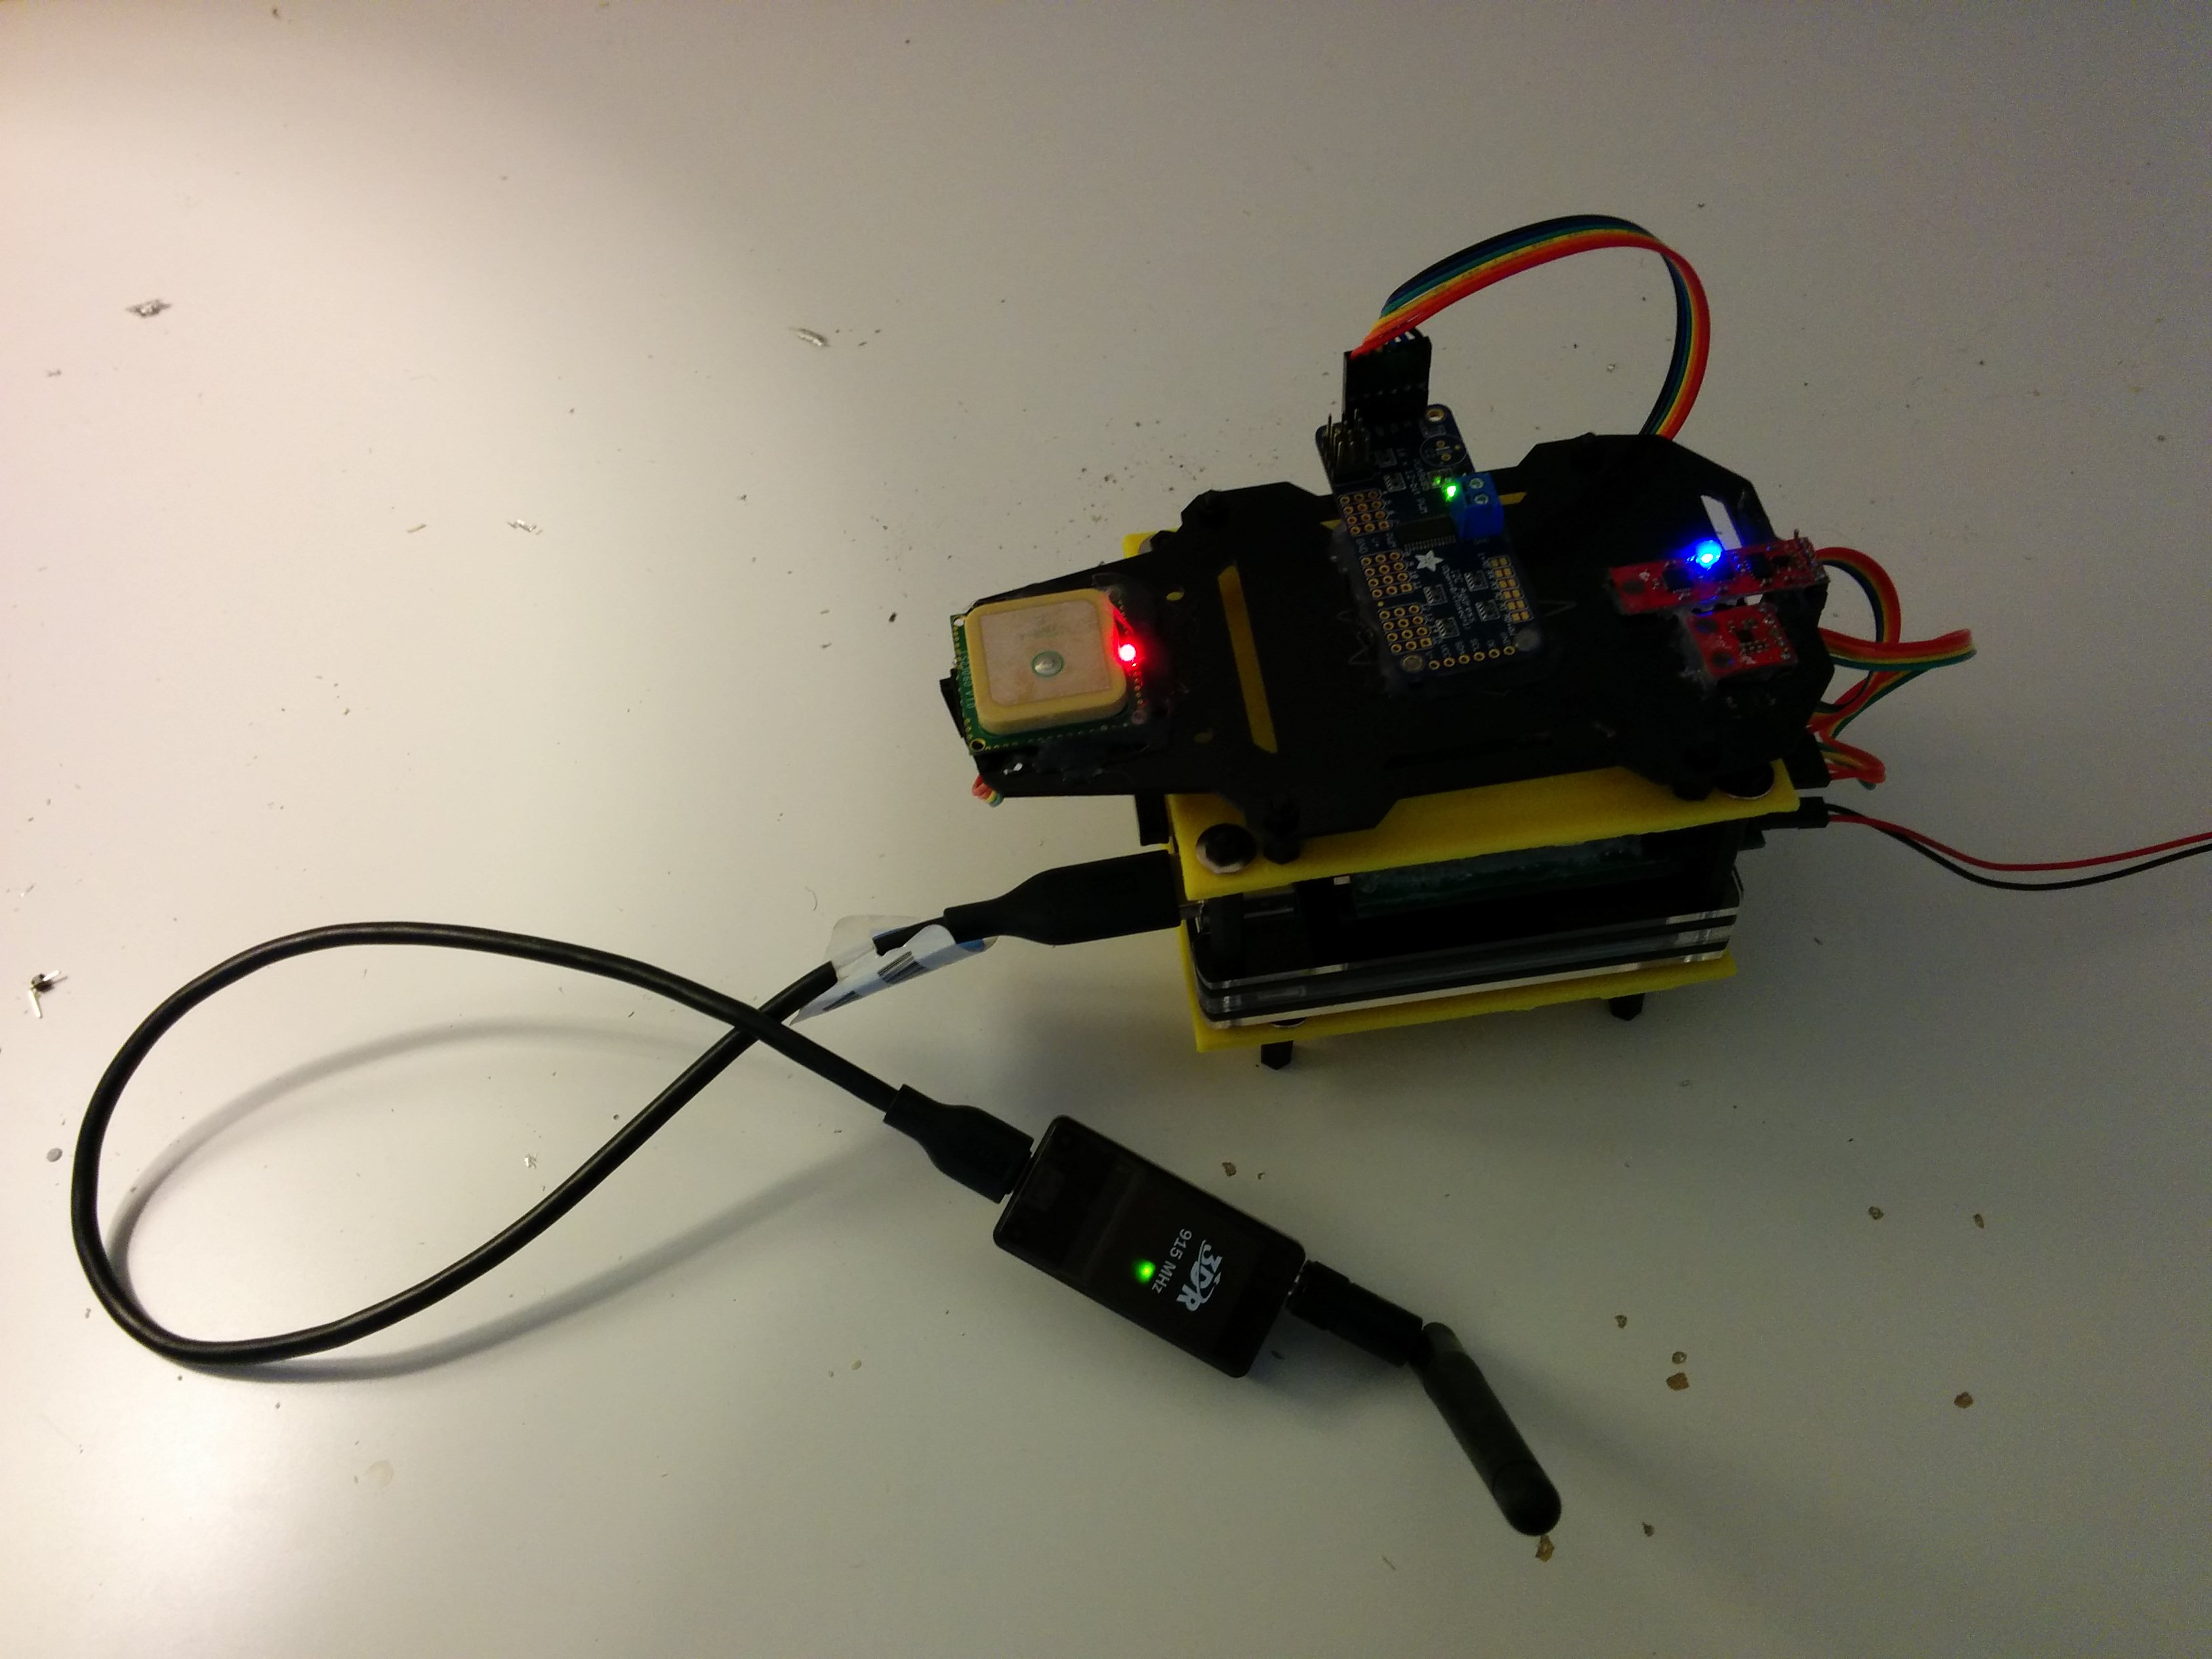
The complete electronics unit is set on a desk and allowed to run, telemetry is sent back to a computer running ground station software using the radio. The configuration of the electronics unit completely matches the flight configuration.
Results
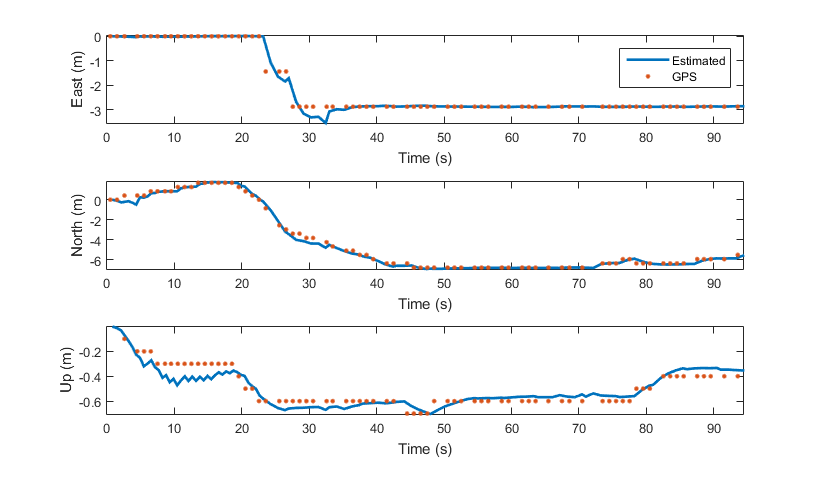
The position correctly tracks the GPS position measurements. Since the indoor GPS environment is poor the GPS measurements do not stay consistent. However, the unit does correctly track the change in GPS position.
Velocity continuously converges to zero. It does not stay zero because the position estimation is following the GPS measurements therefore whenever GPS changes position a estimated velocity is induced and then corrected out.

Roll and pitch both converge to near zero within a few degrees. This is expected as measurements of orientation are under determined and the estimation process for orientation is non-linear. The heading value accurately portrays the heading of the unit.

Acceleration corrected by estimate accelerometer bias converge to near zero. The measured acceleration on the Z axis is near 9.81 (m/s^2) because it is measuring the normal force the table exerts on the electronics unit. The values do not converge exactly to zero because the pitch and roll estimations are not exactly perfect.

Angular velocities corrected by the estimated gyro bias from the kalman filter converge to zero. This indicates correct estimation of gyro bias.

Car Testing
I tested the navigation algorithm further by taking the assembled guidance unit for a ride in my car.
The electronics unit took a ride in my car, a 2011 Subaru outback and took a ride from my apartment to the store. The test data was collected using a netbook tablet running the ground station software.
The position data from the trip shows the car following the road and looks smooth without any noticeable deviations. My parking space was even correct.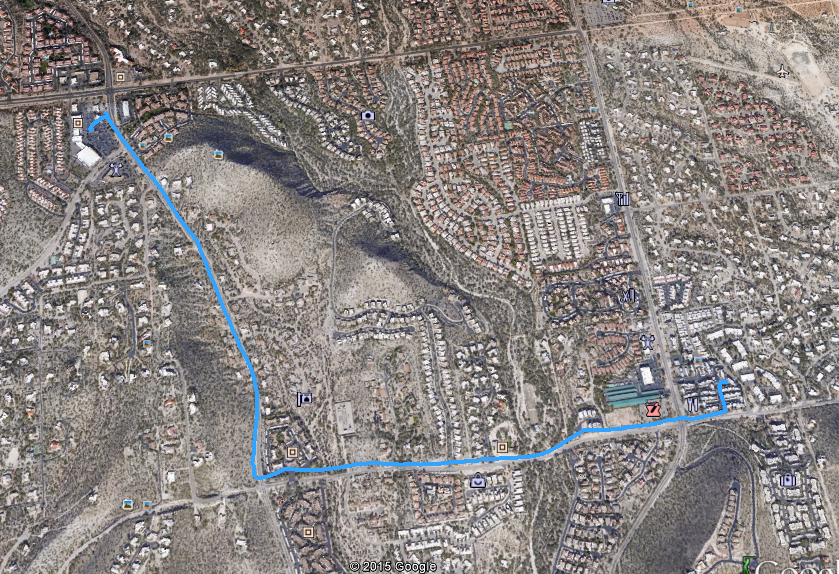
The raw position data follows the received GPS positions but also shows significant smoothing in the altitude coordinate. This shows the filter is properly incorporating accelerometer data and GPS information to estimate state. Furthermore, the hill I need to drive up to go to the store is properly shown.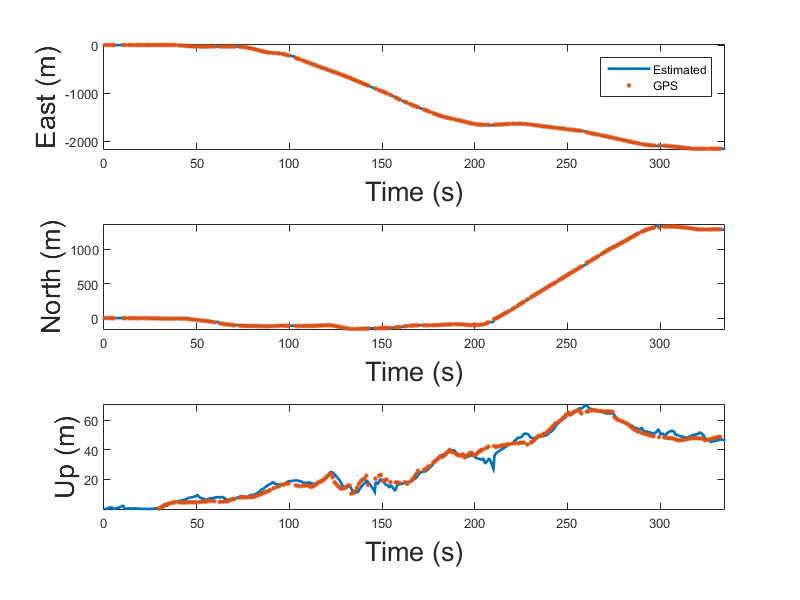
The velocity data similarly shows smoothing effects and hits maximum around 20 m/s ( 44.7 mph ) which is the speed limit of the road.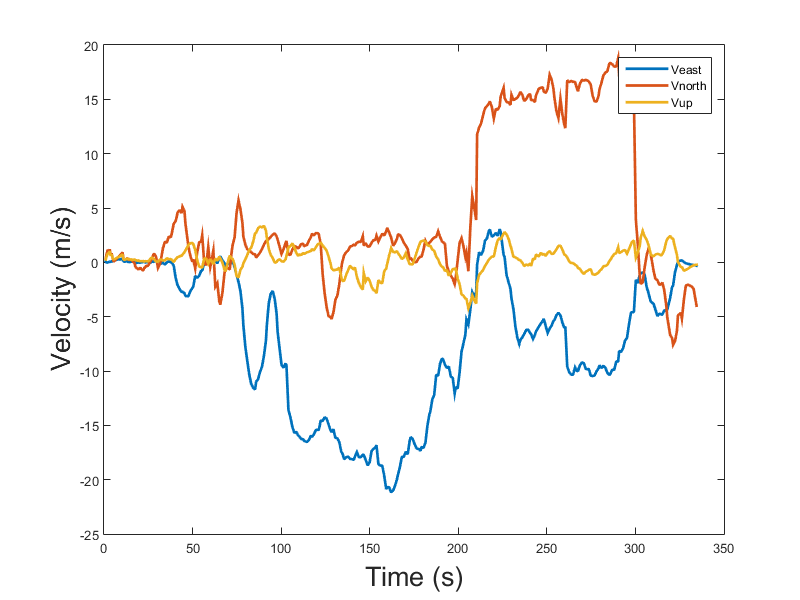
The angle plots also show successful estimation with the roll remaining near constant, as expected in a car. The pitch properly corresponds with the hill on the way to the store. Finally, the heading shows all the major turns to reach the store.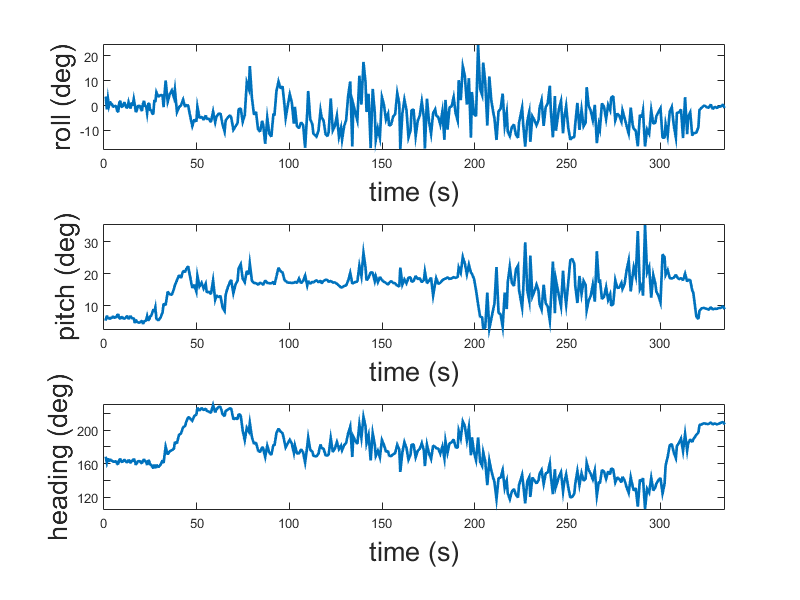
Experimental setup
The electronics unit took a ride in my car, a 2011 Subaru outback and took a ride from my apartment to the store. The test data was collected using a netbook tablet running the ground station software.

The position data from the trip shows the car following the road and looks smooth without any noticeable deviations. My parking space was even correct.

The raw position data follows the received GPS positions but also shows significant smoothing in the altitude coordinate. This shows the filter is properly incorporating accelerometer data and GPS information to estimate state. Furthermore, the hill I need to drive up to go to the store is properly shown.

The velocity data similarly shows smoothing effects and hits maximum around 20 m/s ( 44.7 mph ) which is the speed limit of the road.

The angle plots also show successful estimation with the roll remaining near constant, as expected in a car. The pitch properly corresponds with the hill on the way to the store. Finally, the heading shows all the major turns to reach the store.

Software in the Loop
Testing the real flight software in a simulation environment allows validation without ever stepping in to the field! This is achieved by running a simulation which links to a real copy of the flight software using UDP as an interface. I call this a "Software in the Loop Simulation" (SIL)
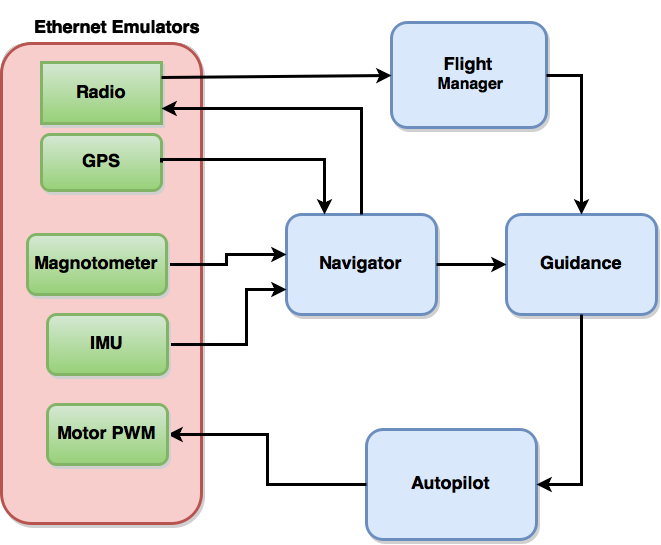
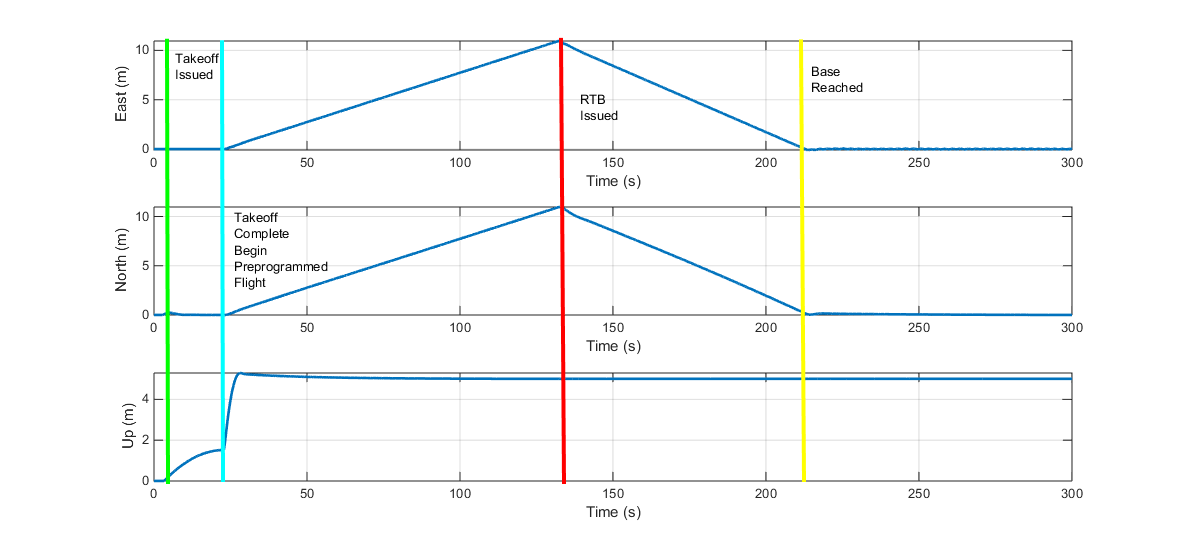
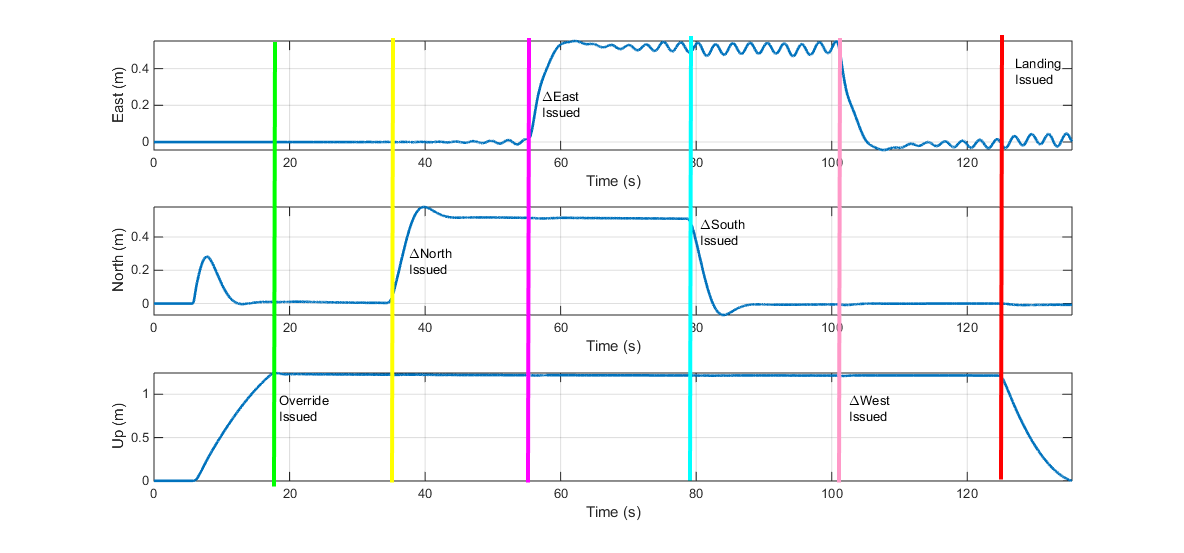
Using the SIL I am able to test all the flight software algorithms as well as the command and control functionality of the GUI. I've included some basic SIL results showing testing of takeoff, landing, pre-programmed flight, return to base, override and landing
Simulation Testing
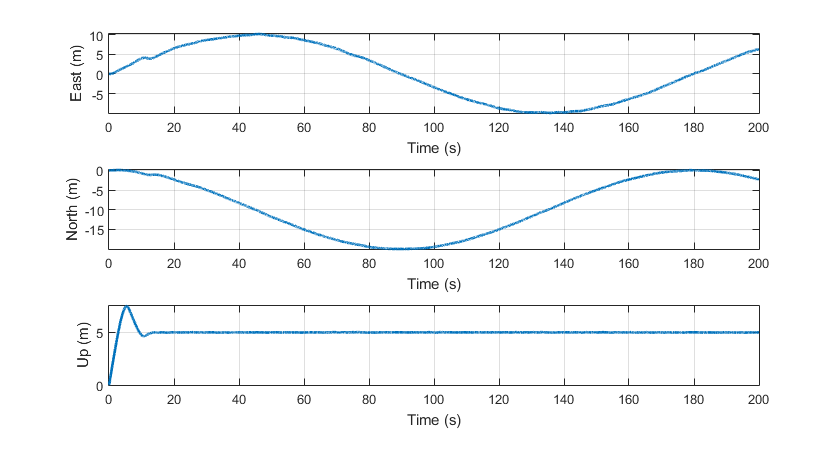
Flying various trajectories in a simulation only environment provides the opportunity to examine controller robustness. The specific trajectory examined here is a circular flight path with 10 meter radius. Other trajectories were used to fully ring out the controller and navigator design but this specific example is representative of most of them. Position follows a 10 meter circle with a constant 5 meter altitude. This indicates that overall the guidance and navigation system is working properly.
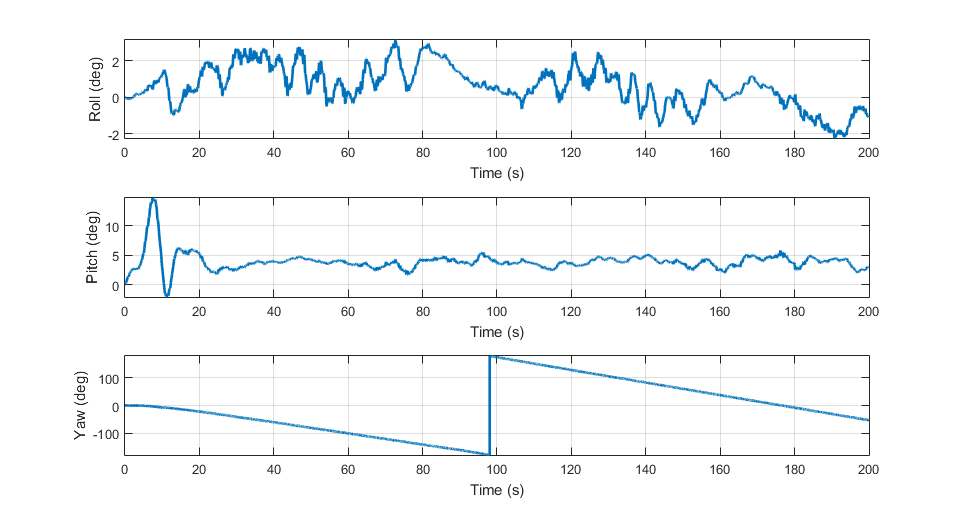
The roll, pitch and yaw angles for the circular flight path also make sense. Pitch levels out at a constant angle which is expected to meet the constant velocity of the trajectory. Roll is near zero but varies due to noise and stabilization maneuvers. Yaw tracks through the full 360 degrees of the circular trajectory showing that the drone points 'forward' the whole time.
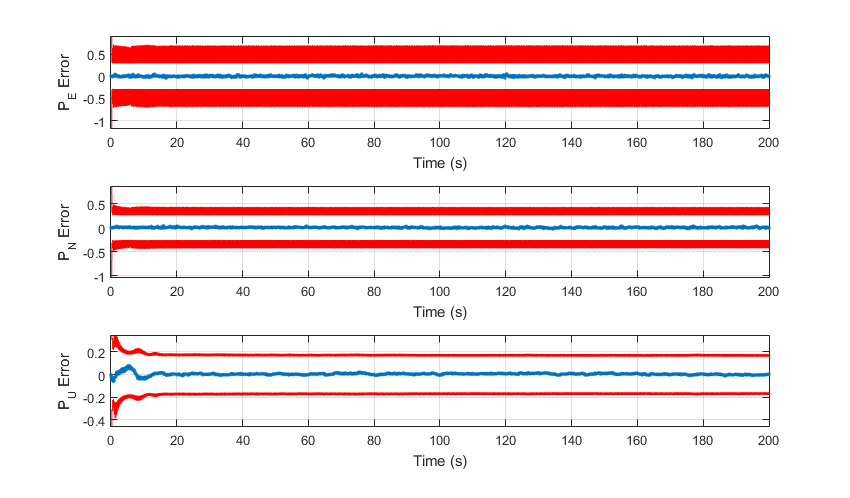
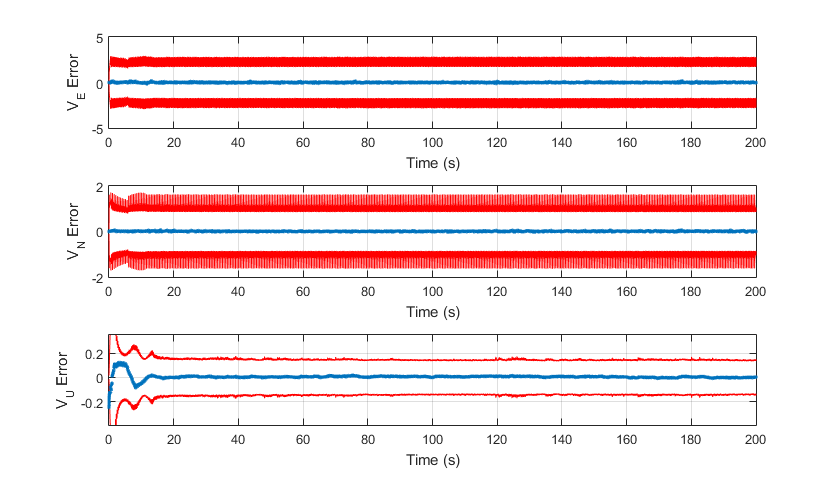
The following plots show the navigation errors when compared to simulated truth. The red lines represent the one sigma error expected by the navigation filter. The navigation position error for the entire flight stays less than 1 meter which shows good navigation performance.
The velocity error is around 0.1 m/s which shows that the navigation filter has converged and is properly correcting for accelerometer bias.
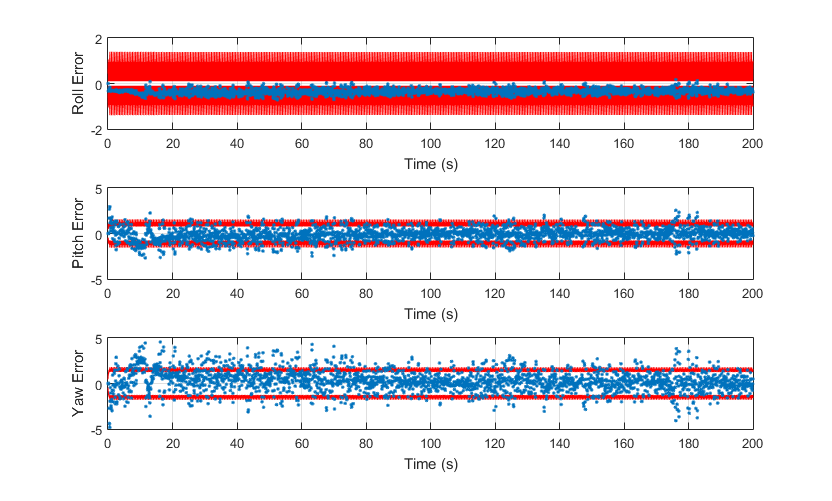
Orientation errors stay in the 2-3 degree range which is in line with the filter estimates and shows the filter is correctly correcting for gyro bias.
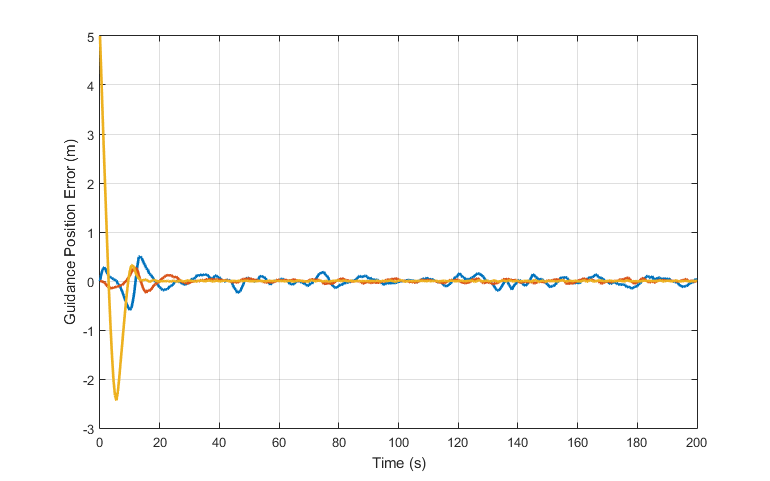
Checking the guidance errors can show the overall performance of the controllers in the entire system. Guidance position error quickly converges to zero on all axes therefore the controllers are properly following commands.
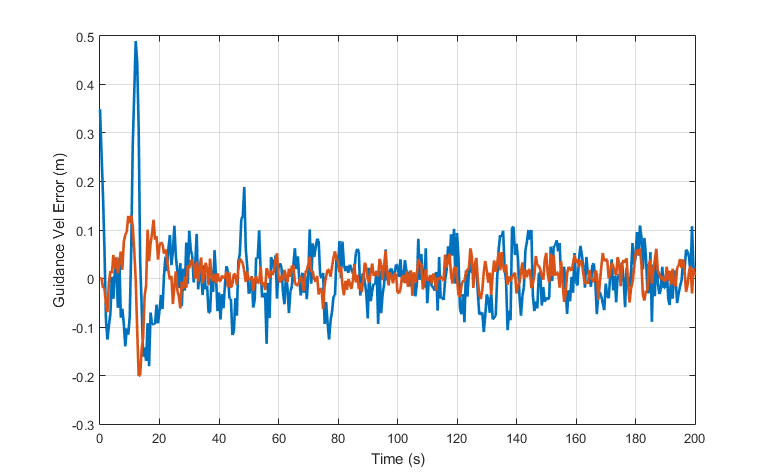
Guidance velocity errors show a similar story as the error quickly converges to within the noise inputs generated by the navigation filter.
Stabilization Test
Coming Soon!
Measuring Inertia Properties
Coming Soon!